Introducing Tayga: every failing request, explained
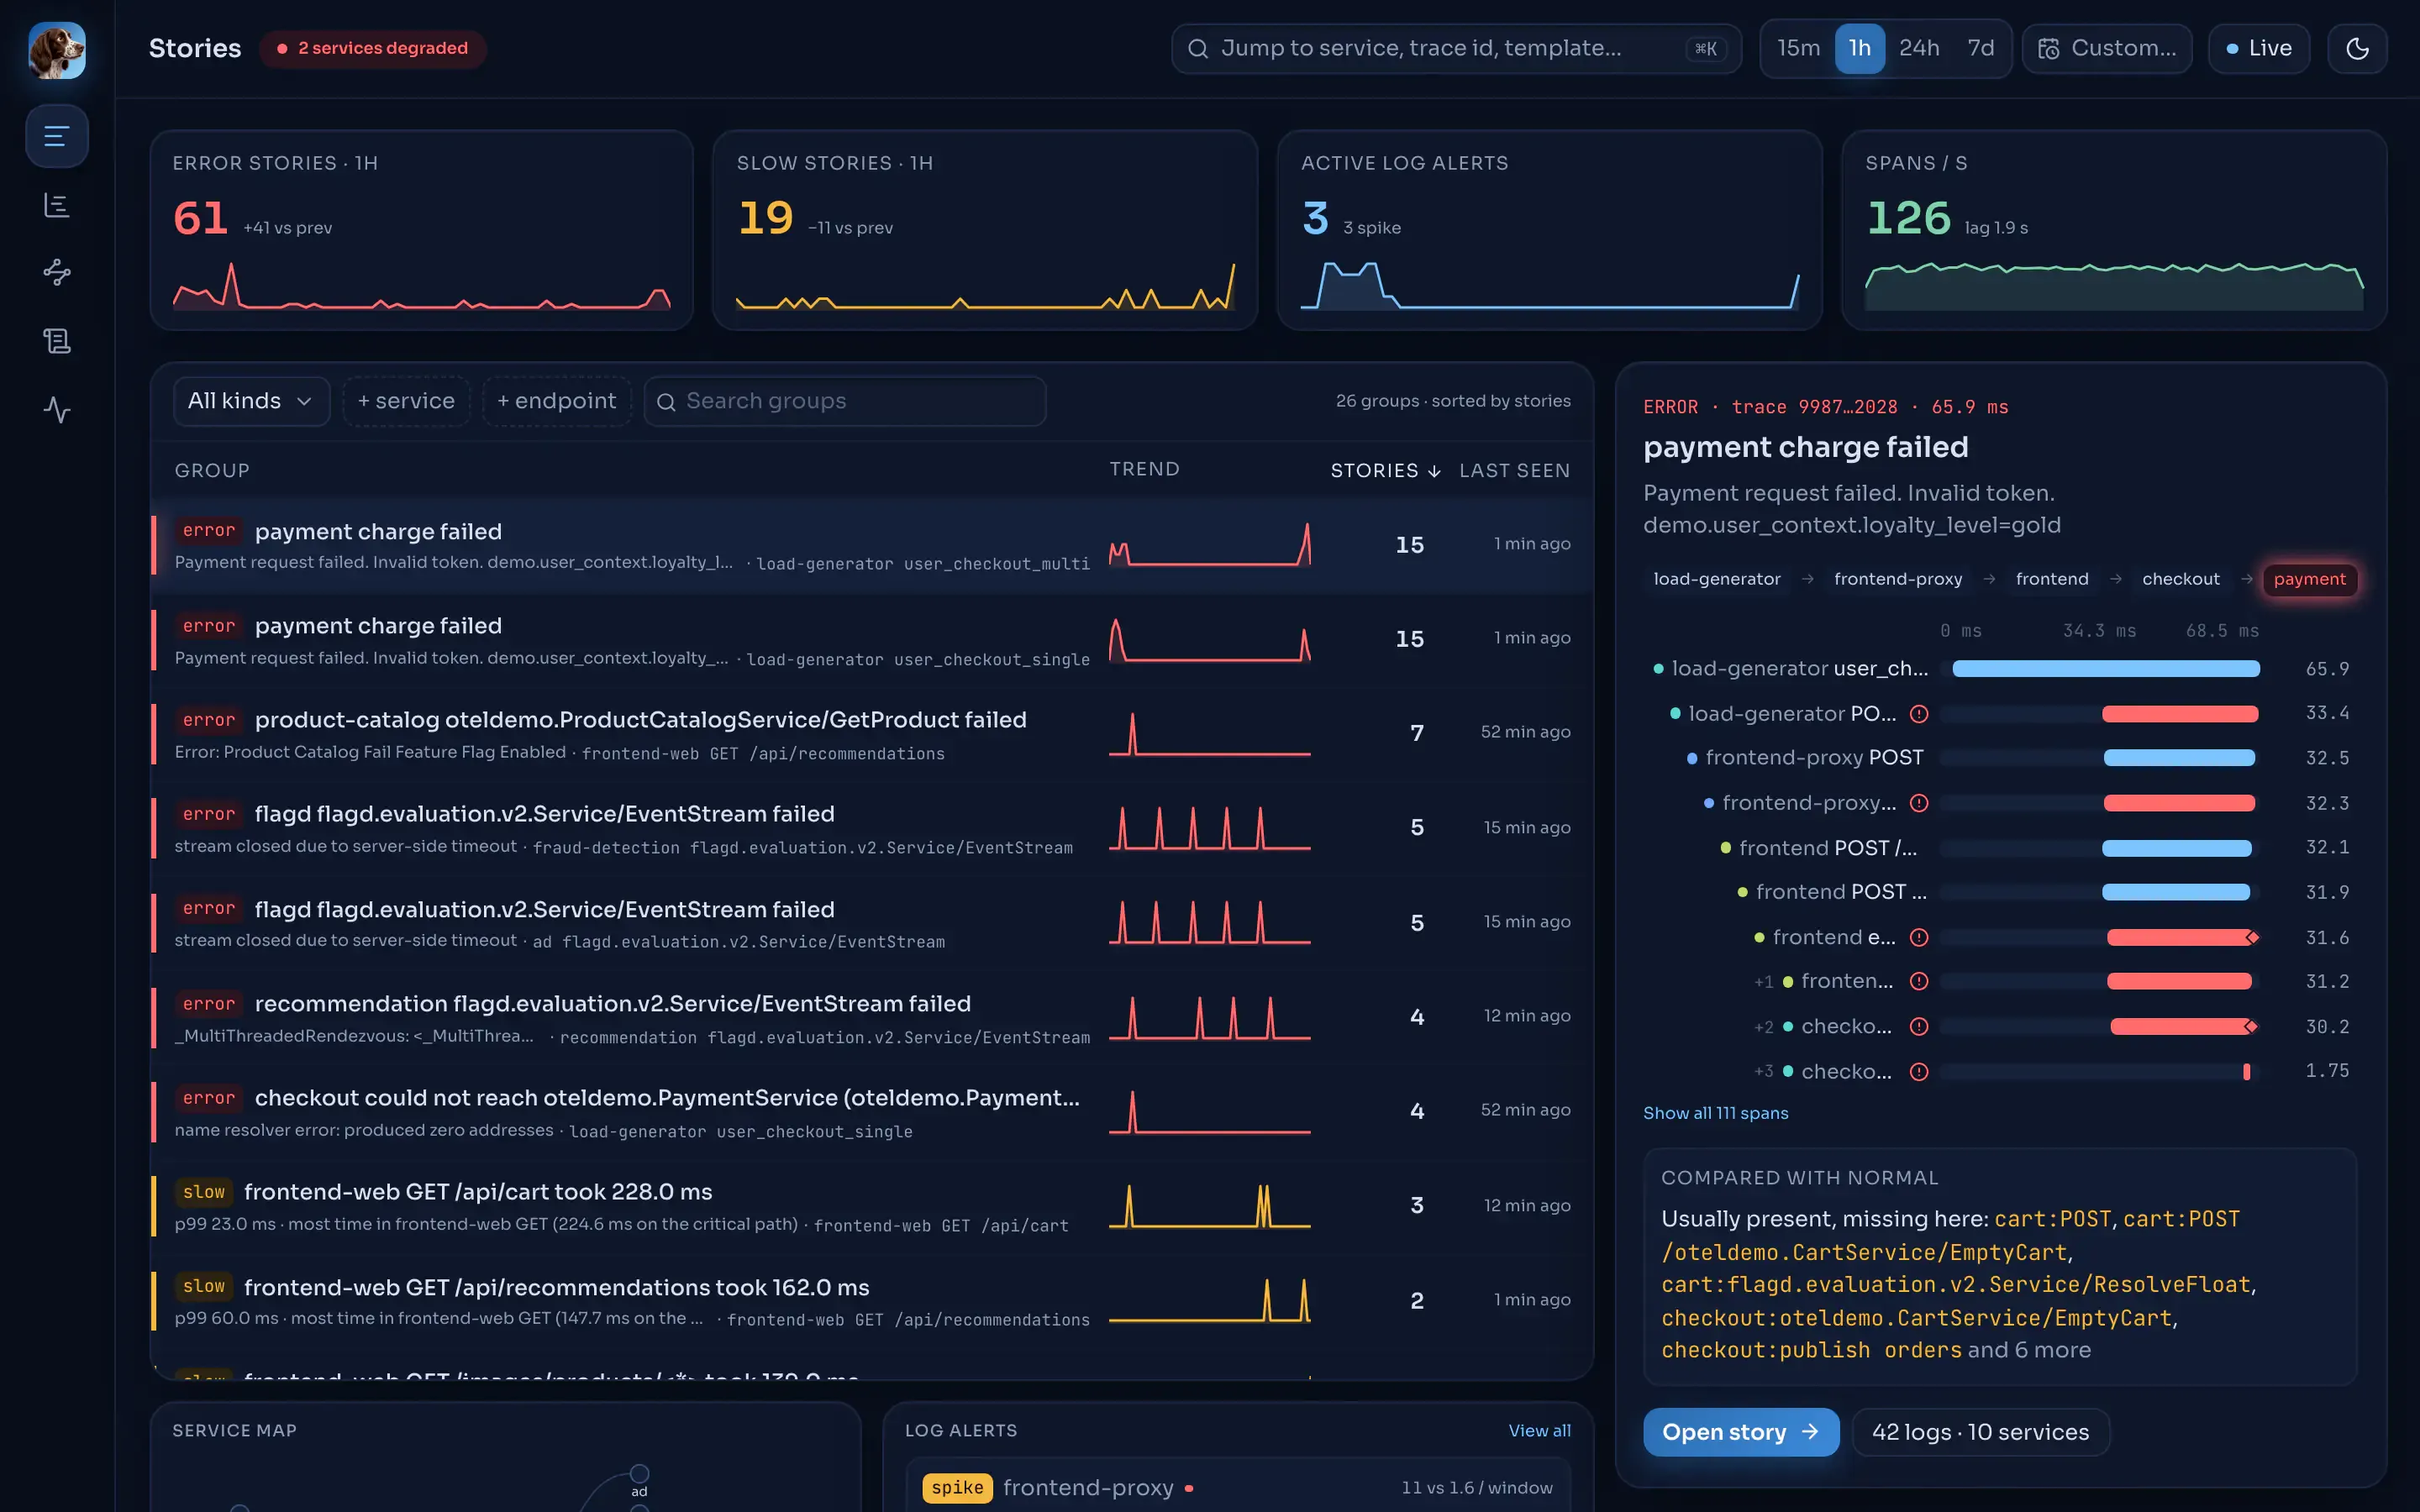
Tayga turns OpenTelemetry traces and logs into error stories, with a root cause, a critical path and a diff against normal. v0.1.0 is out, self-hosted and AGPL.
OpenTelemetry traces and logs turned into error stories with root cause and critical path.
When a request fails across your services, OpenTelemetry gives you every span and every log line, and leaves the reading to you: find the span that broke, work out what normal looks like for that endpoint, dig out the logs that matter. Repeats of one problem show up as hundreds of separate traces.
curl -fsSL https://raw.githubusercontent.com/softberries/tayga/master/scripts/install.sh | shTayga analyses traces as they stream in. tayga-ingest receives OTLP and publishes one record
per trace id to Redpanda, keyed by trace id, so every span of a trace lands on the same
partition. The assembler closes a trace after 10 s without new spans (60 s at most), builds the
span tree, and turns failing and slow requests into stories with a root cause, a critical path
and a baseline diff. By the time you open Tayga, the failing requests are already explained.
The installer runs Tayga, ClickHouse and Redpanda on one host with Docker Compose; any OpenTelemetry Collector connects with one exporter. For Kubernetes there is a Helm chart.
Tayga is a focused tool. It does not ingest OTel metrics, so for dashboards you build yourself Grafana and Prometheus sit next to it. Its root cause is always a span, so infrastructure failures are out of reach. It is young, and has been tested against the OpenTelemetry demo. It can run alongside your existing stack: it takes OTLP from the same Collector, and its trace view links out to Jaeger.
The core is AGPLv3. Tayga Enterprise, with SSO, multi-tenancy, high availability and support, is available on request under a commercial license, priced per cluster or node rather than per GB.
Tayga turns OpenTelemetry traces and logs into error stories, with a root cause, a critical path and a diff against normal. v0.1.0 is out, self-hosted and AGPL.